
Introduction
Oracle Enterprise Manager 24ai provides centralized monitoring and management capabilities for Oracle database environments, including Oracle Exadata Database Machines.
Discovering an Exadata Database Machine in Enterprise Manager enables administrators to monitor its hardware components, compute nodes, storage servers, network switches, and power distribution units (PDUs) from a centralized management console.


This guide explains how to discover an Oracle Exadata Database Machine using Oracle Enterprise Manager 24ai. It covers the discovery wizard, prerequisite validation, hardware component selection, monitoring agent configuration, credential management, storage management options, and final target promotion.
The example environment includes a two-node Exadata compute configuration, five Exadata storage servers, Ethernet switches, and PDUs.
How to Install Oracle Enterprise Manager 24AI on RHEL
Prerequisites
Before starting the discovery process, verify the following requirements.
1. Oracle Enterprise Manager 24ai
Ensure that Oracle Enterprise Manager 24ai is installed, operational, and accessible.
2. Oracle Management Agent
A suitable Oracle Management Agent must be deployed and able to communicate with the Exadata environment.
Example agent URL:
https://oem-agent.example.com:3872/emd/main/Verify that the agent is running and secure communication is operational.
3. Network connectivity
Ensure that the Management Server and the selected monitoring agent can communicate with the required Exadata components, including:
- Compute nodes and ILOM interfaces.
- Exadata storage servers.
- Ethernet switches.
- Power distribution units.
- Oracle Management Server and Management Agents.
Validate the required ports against the applicable Oracle documentation and your network configuration.
4. Required credentials
Prepare the necessary credentials for:
- Oracle Management Agent host.
- Compute node ILOM interfaces.
- Exadata storage servers.
- Ethernet switches.
- Power distribution units.
Use accounts with the appropriate privileges and store credentials securely.
5. Oracle Virtual Infrastructure plug-in
During the discovery process, the prerequisite check may display the following critical error:
Oracle Virtual Infrastructure Plug-in is not deployed
on the Management Server.
Check whether the plug-in is required for your Exadata configuration and Enterprise Manager release. If required, deploy a compatible version and retry the prerequisite check.
Step 1: Start Exadata Database Machine Discovery
Log in to Oracle Enterprise Manager 24ai using an account with the necessary administrative privileges.
Navigate to:
Setup → Add Target → Add Targets Manually → Add Targets Using Guided Process
Select Oracle Exadata Database Machine and start the guided discovery process.
The wizard contains eight steps:
- Discovery Inputs
- InfiniBand Discovery
- Prerequisite Check
- Components
- Monitoring Agents
- Credentials
- Storage Management
- Review
Follow the wizard to identify the Exadata hardware and register the components as Enterprise Manager targets.
Step 2: Configure Discovery Inputs
On the Discovery Inputs page, specify the Oracle Management Agent that will perform the discovery.
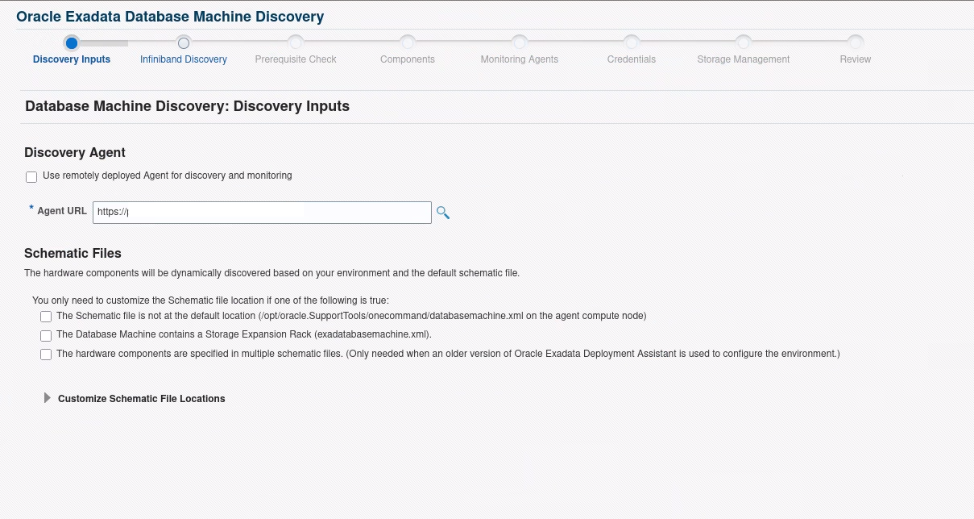
Example:
https://oem-agent.example.com:3872/emd/main/The wizard also provides options for customizing the schematic files used to discover the Exadata hardware.
The default schematic file location shown in the discovery wizard is:
/opt/oracle.SupportTools/onecommand/databasemachine.xmlYou may need to customize the schematic file location when:
- The file is not available at the default location.
- The Database Machine includes a Storage Expansion Rack.
- The hardware components are defined in multiple schematic files.
Use the default configuration when it correctly represents your environment.
Click Next to continue.
Step 3: Perform Interconnect Discovery
The discovery wizard identifies the interconnect technology used by the Exadata Database Machine.
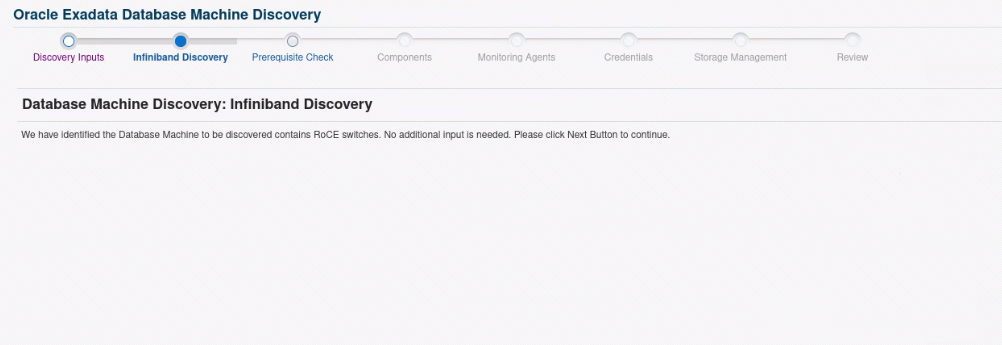
In this example, Enterprise Manager detected a configuration containing RoCE switches and indicated that no additional input was required.
RoCE (RDMA over Converged Ethernet) provides an Ethernet-based interconnect for supported Exadata configurations.
Click Next to continue.
Step 4: Resolve the Prerequisite Check Error
The prerequisite check validates whether the environment meets the requirements for Exadata discovery.
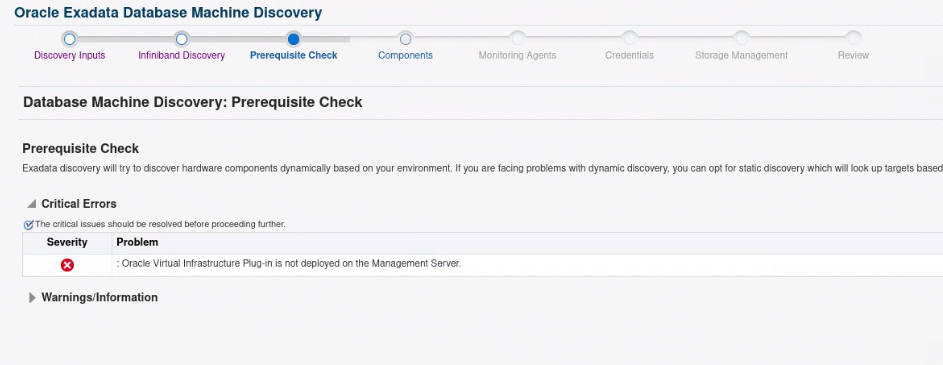
The following error may appear:
Oracle Virtual Infrastructure Plug-in is not deployed
on the Management Server.
Troubleshooting steps
1. Open the plug-in management page
Navigate to:
Setup → Extensibility → Plug-ins
Review the deployed plug-ins and their versions.
2. Verify the required plug-in
Confirm whether the Oracle Virtual Infrastructure plug-in is required for the specific discovery workflow and Enterprise Manager release.
3. Deploy the plug-in if necessary
If the plug-in is required but missing, deploy a compatible version using Enterprise Manager’s plug-in management interface.
4. Retry the prerequisite check
Return to the discovery wizard and click Retry.
Resolve any remaining critical errors before proceeding.
Step 5: Select Exadata Hardware Components
The Components page displays the hardware identified during discovery.
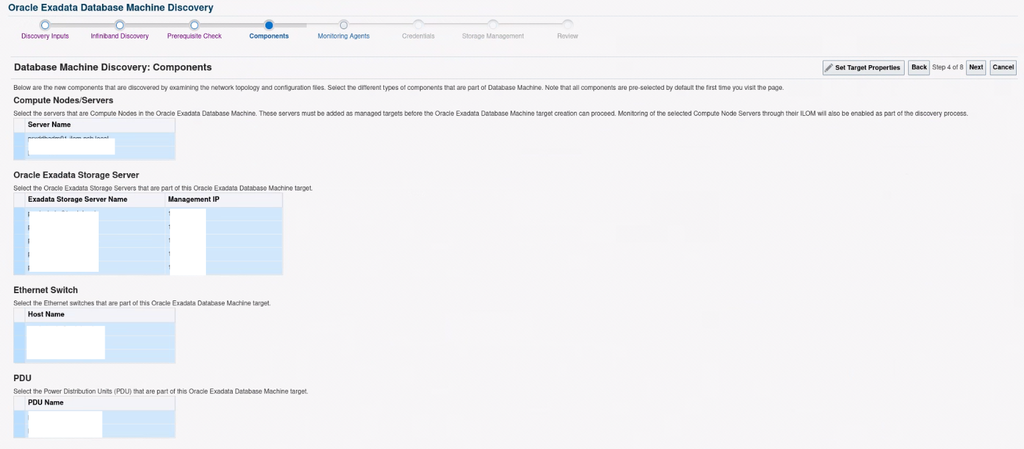
5.1 Compute Nodes
The example environment contains two compute nodes:
exacomp01.example.com
exacomp02.example.com
These are generic example hostnames. Replace them with the actual compute node names in your environment.
Compute nodes host the Oracle Database and Grid Infrastructure software in a typical physical Exadata deployment.
5.2 Exadata Storage Servers
Five storage servers were identified in the example configuration.
| Storage Server | Example Management IP |
|---|---|
| exacell01.example.com | 192.0.2.13 |
| exacell02.example.com | 192.0.2.14 |
| exacell03.example.com | 192.0.2.15 |
| exacell04.example.com | 192.0.2.16 |
| exacell05.example.com | 192.0.2.17 |
The IP addresses above are documentation examples, not production addresses.
5.3 Ethernet Switches
The example configuration includes three Ethernet switches:
exasw-adm.example.comexasw-rocea.example.comexasw-roceb.example.com
These represent the management and RoCE network components identified during discovery.
5.4 Power Distribution Units
The example configuration contains two PDUs:
exapdu01.example.comexapdu02.example.com
Review the selected components and verify that they match the intended Exadata hardware configuration.
Where supported, use Set Target Properties to configure the required properties.
Click Next to continue.
Step 6: Configure Monitoring Agents
The Monitoring Agents page assigns agents to the Database Machine and its hardware components.
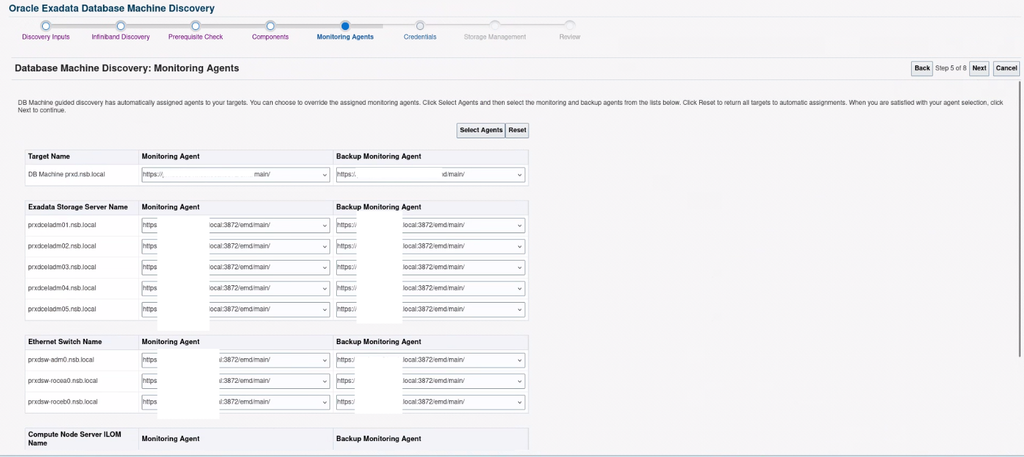
Example monitoring agent:
https://oem-agent.example.com:3872/emd/main/Enterprise Manager can automatically assign monitoring agents. You can also select different agents when required.
Review the assignments for:
- Database Machine.
- Exadata storage servers.
- Ethernet switches.
- Compute node ILOM targets.
- Other supported hardware components.
Ensure that the selected agents are running, can communicate with their assigned targets, and support the required monitoring functions.
Configure the backup monitoring agent appropriately for your environment.
Click Next to continue.
Step 7: Configure Credentials
The Credentials page allows you to configure the authentication details required to monitor the discovered components.
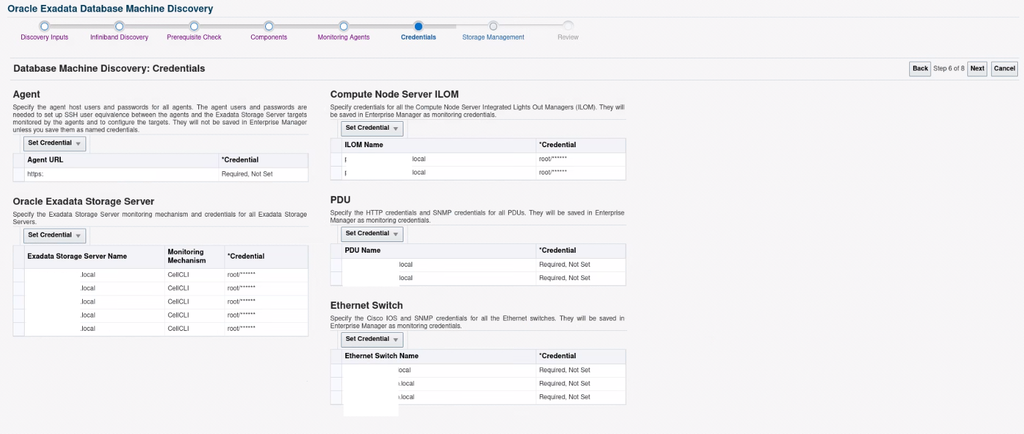
7.1 Agent credentials
Configure the required credentials for the monitoring agent host.
7.2 Exadata Storage Server credentials
In this example, the storage servers use the CellCLI monitoring mechanism.
Monitoring Mechanism: CellCLIVerify that the credentials are valid for the selected monitoring mechanism.
7.3 Compute Node ILOM credentials
Configure the appropriate credentials for the compute node ILOM interfaces.
Test authentication where the wizard provides this option.
A successful authentication test confirms that the selected credentials can authenticate against the tested interface.
7.4 Ethernet switch credentials
Configure the appropriate credentials for each switch based on its hardware and supported monitoring mechanism.
7.5 PDU credentials
Configure the required HTTP and SNMP credentials for the PDUs.
Credential validation checklist
Before continuing, verify that:
- Required credentials are configured.
- Authentication tests succeed where available.
- The accounts have sufficient privileges.
- Management interfaces are reachable.
- Credentials are stored securely.
Use dedicated monitoring accounts with the minimum privileges necessary wherever supported.
Click Next to continue.
Step 8: Review Storage Management Settings
The Storage Management page displays information about Oracle Exadata Exascale.
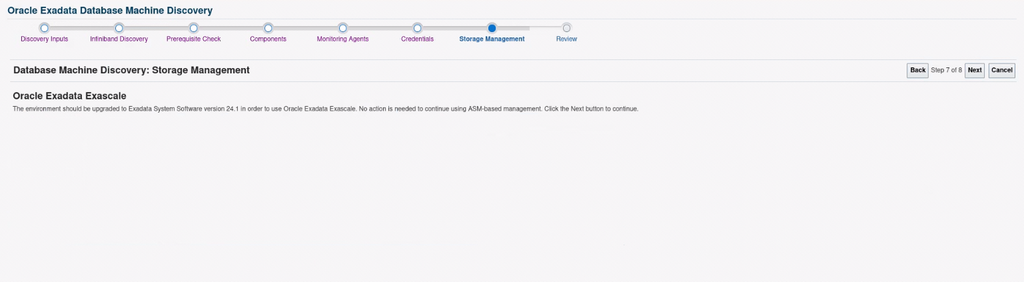
The discovery wizard may indicate that a particular Exadata System Software version is required to use Exascale while allowing the environment to continue with ASM-based management.
If your environment uses ASM-based storage management and you do not intend to configure Exascale, follow the applicable instructions displayed by the wizard.
If you plan to use Exascale, verify the required software version, supported configuration, and upgrade procedure before enabling it.
Click Next to proceed.
Step 9: Review the Discovery Configuration
The Review page summarizes the targets that will be created in Enterprise Manager.
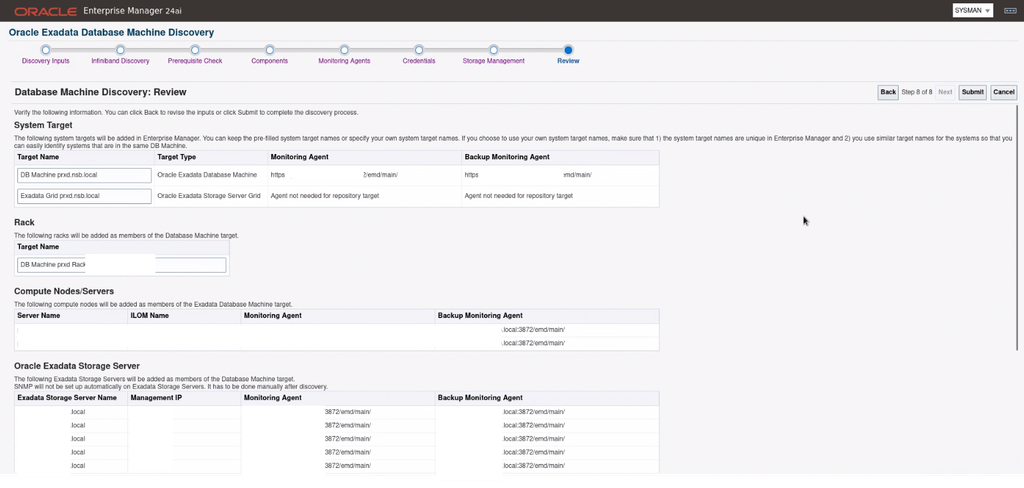
Example system targets:
| Target Name | Target Type |
|---|---|
| Exadata Database Machine | Oracle Exadata Database Machine |
| Exadata Storage Grid | Oracle Exadata Storage Server Grid |
The page also lists the rack, compute nodes, storage servers, Ethernet switches, and PDUs.
Before submitting, verify:
- The Database Machine target name.
- The compute node and ILOM mappings.
- Storage server names and management IP addresses.
- Monitoring agent assignments.
- Required credentials.
- The selected hardware components.
Once everything is correct, click Submit to initiate target creation and promotion.
Step 10: Verify Successful Target Creation
After submitting the discovery, Enterprise Manager displays the Target Creation Summary.
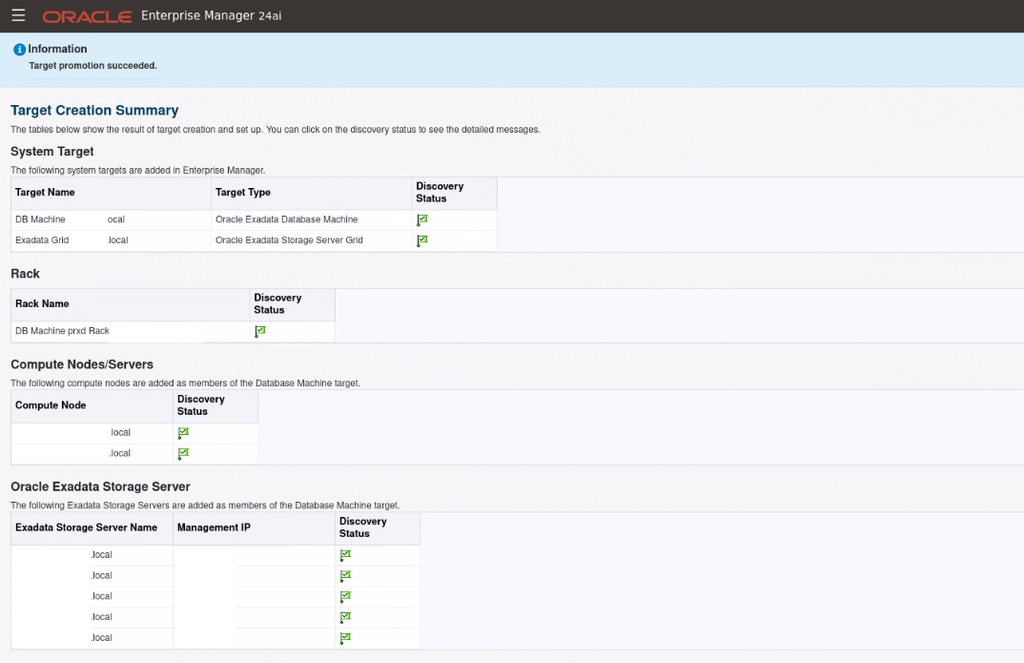
A successful discovery displays a confirmation message similar to:
Target promotion succeeded.Verify that the summary reports successful discovery status for the Database Machine and Exadata Storage Server Grid.
Also check the discovery status of the individual components:
- Rack.
- Compute nodes.
- Exadata storage servers.
- Ethernet switches.
- PDUs.
Successful target promotion confirms that the target creation workflow completed for the components reported in the summary. It does not necessarily mean that all monitoring metrics are already being collected.
Post-discovery validation
1. Open the Database Machine target
Navigate to the newly created Exadata Database Machine target and verify that its home page loads correctly.
2. Review the hardware hierarchy
Confirm that the compute nodes, storage servers, switches, and PDUs appear under the expected target hierarchy.
3. Check target availability
Review the status of the newly discovered targets and investigate unexpected Down statuses.
4. Verify metric collection
Check the relevant monitoring pages and confirm that supported metrics are being collected.
5. Configure alerts
Review monitoring thresholds and notification settings according to operational requirements.
6. Discover Grid Infrastructure and database targets
Use the options provided in the discovery summary to add Cluster Targets and Database and ASM Targets if they have not already been discovered.
7. Complete hardware monitoring configuration
Review any additional monitoring requirements. For example, the discovery workflow may require SNMP to be configured manually on Exadata storage servers.
Follow the applicable Oracle documentation to complete this configuration.
Troubleshooting Common Exadata Discovery Issues
| Issue | Recommended Action |
|---|---|
| Oracle Virtual Infrastructure plug-in prerequisite error | Verify the requirement and deploy a compatible plug-in if necessary. |
| Monitoring agent is unavailable | Check agent status, secure communication, and connectivity. |
| Schematic file cannot be found | Verify the file location, permissions, and hardware configuration. |
| ILOM authentication fails | Validate credentials, management connectivity, and privileges. |
| Storage server credentials fail | Verify CellCLI configuration and the supplied credentials. |
| Ethernet switch discovery fails | Check connectivity, credentials, and monitoring compatibility. |
| PDU discovery or monitoring fails | Verify management connectivity and HTTP or SNMP configuration. |
| Targets are discovered but metrics are unavailable | Check target status, agent availability, credentials, and monitoring configuration. |
Conclusion
Oracle Enterprise Manager 24ai simplifies the centralized discovery and management of Oracle Exadata Database Machines.
This guide covered the complete discovery workflow, including initial inputs, interconnect detection, prerequisite validation, hardware selection, monitoring agent assignment, credential configuration, storage management, and target promotion.
Following successful discovery, administrators should validate target availability, metric collection, alerts, and any additional monitoring configuration required by the environment.
With these checks completed, Oracle Enterprise Manager provides a centralized starting point for monitoring and managing the Exadata Database Machine infrastructure.