
PostgreSQL performance can deteriorate as data volumes increase, applications become busier, and queries become more complex. Database administrators need a structured approach to identify bottlenecks rather than changing configuration parameters without evidence.
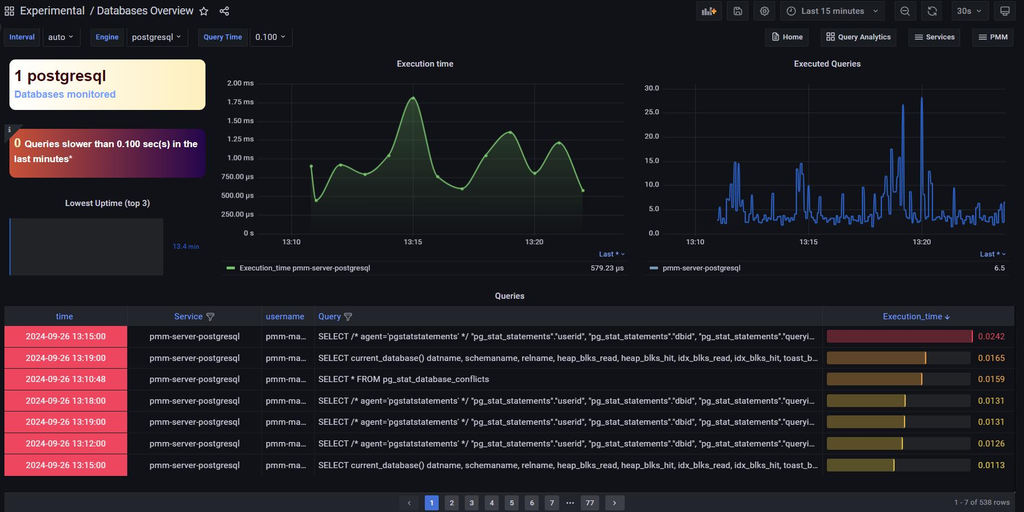
This guide covers practical PostgreSQL performance tuning techniques.


1. Identify Active and Long-Running Queries
Use pg_stat_activity to inspect active database sessions.
SELECT
    pid,
    usename,
    datname,
    state,
    NOW() - query_start AS query_duration,
    wait_event_type,
    wait_event,
    LEFT(query, 150) AS query_text
FROM pg_stat_activity
WHERE state <> 'idle'
ORDER BY query_start NULLS LAST;
Investigate long-running queries, lock waits, and sessions that remain active unexpectedly.
A long-running query is not necessarily a problem; some reporting and batch operations are expected to take longer.
2. Analyze Query Execution Plans
PostgreSQL provides EXPLAIN and EXPLAIN ANALYZE to help identify expensive operations.
EXPLAIN (ANALYZE, BUFFERS)
SELECT *
FROM orders
WHERE customer_id = 1001;
Review the execution plan for:
- Sequential scans on large tables.
- Expensive joins and sorts.
- Large differences between estimated and actual row counts.
- Excessive disk reads.
- Repeated operations with high execution costs.
EXPLAIN ANALYZE executes the query. Use caution with statements that modify data, especially in production.
3. Review Index Usage
Indexes can improve query performance, but unnecessary indexes increase storage usage and the cost of inserts, updates, and deletes.
SELECT
    schemaname,
    relname AS table_name,
    indexrelname AS index_name,
    idx_scan,
    idx_tup_read,
    idx_tup_fetch
FROM pg_stat_user_indexes
ORDER BY idx_scan ASC;
Low index usage is a reason to investigate, not an automatic reason to drop an index. An index may support infrequent but important queries or enforce a constraint.
4. Review Important Configuration Parameters
Inspect the current configuration before making changes.
SHOW shared_buffers;
SHOW work_mem;
SHOW maintenance_work_mem;
SHOW effective_cache_size;
SHOW max_connections;
Tune these settings based on available RAM, workload, concurrency, query plans, and operating system limits.
For example, increasing work_mem may help operations that spill to disk, but it can consume substantial memory when many sessions execute multiple operations concurrently.
5. Maintain Database Statistics
The query planner relies on statistics to select execution plans.
ANALYZE;For routine maintenance, PostgreSQL’s autovacuum and auto-analyze processes should normally remain enabled and appropriately configured.
Monitor table bloat, dead tuples, vacuum activity, and transaction ID age when investigating performance or maintenance problems.
Conclusion
PostgreSQL performance tuning starts with measurement. Identify expensive queries, examine execution plans, review indexes, monitor resource consumption, and maintain accurate statistics.
Make one controlled change at a time and compare performance before and after the change. This evidence-based approach helps DBAs improve performance while minimizing production risk.
How to Install PostgreSQL on Red Hat Enterprise Linux and Oracle Linux